Difference in Differences Analysis Assessing the Impact of State Minimum Wage Increase on Various State Economic Indicators
This is an analysis I did for a class assignment to learn DID. Cool, fun stuff so I'm putting it on the internet.

Treatment and Control Group Selection and Parallel Trends Analysis
The chosen treatment and control groups for this DID analysis are Georgia and North Carolina. Both Georgia and North Carolina had a State Minimum Wage of $5.15 from 2002 through 2006. From 2007 through 2010, North Carolina increased its State Minimum Wage incrementally from $5.15 to $7.25. North Carolina’s Minimum remains at $7.25 today, while Georgia’s State Minimum Wage has remained at $5.15. This was deduced with a table function (Figure B).
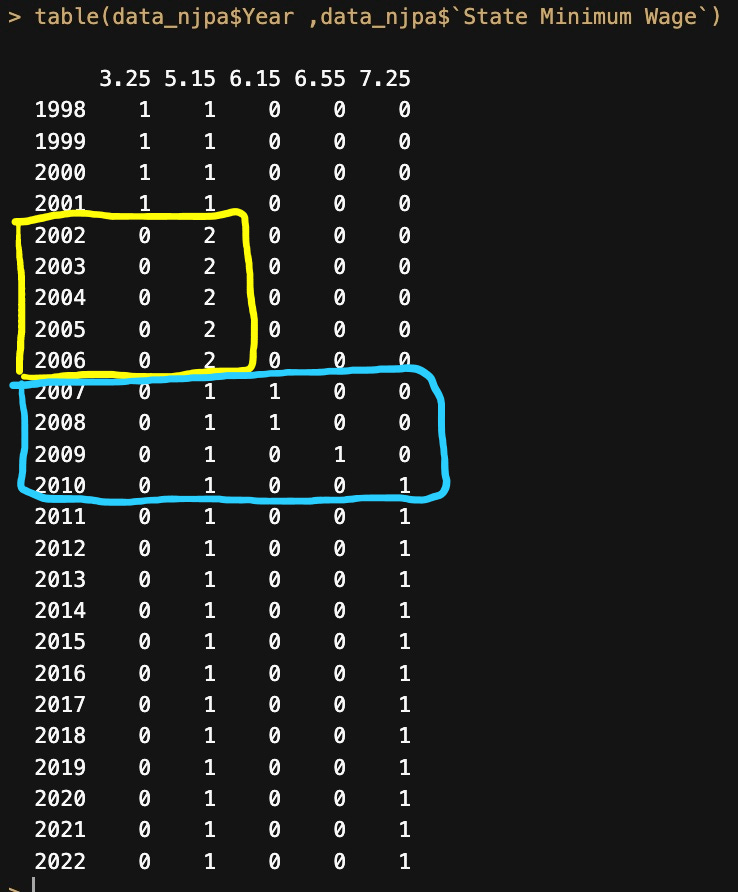
Figure B: Table function output.The 2002-2006 period of stability in shared State Minimum Wage is boxed in yellow. The period where North Carolina underwent the “treatment” of increasing the State Minimum Wage from 2007-2010 is boxed in Blue.
Since North Carolina began increasing its State Minimum Wage in 2007, and our two states had the same minimum wage from 2002-2006, I performed an analysis to test the assumption of parallel trends during the State Minimum Wage similarity period. The analysis of trends of 8 economic indicator variables, viewable in the multiplot in Figure C, indicates suitability of these states for DID analysis because of the visually parallel trends in economic variables in the pre-treatment period of 2002-2006.
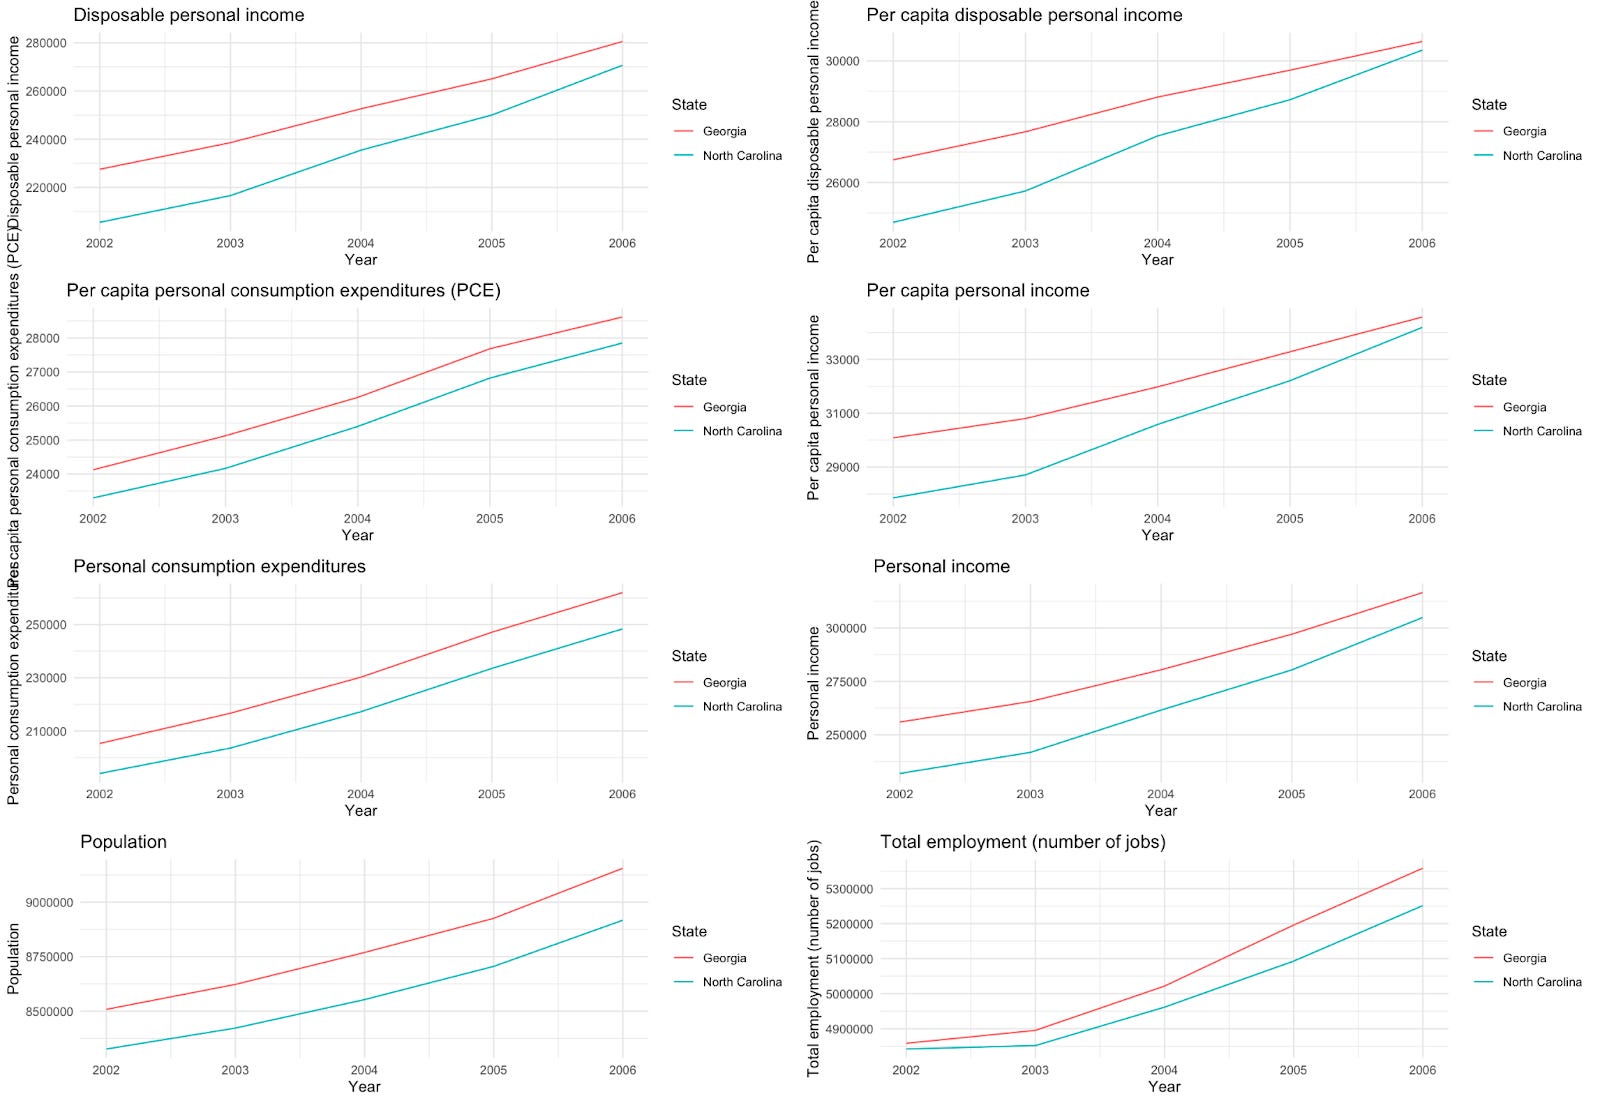
Figure C: Parallel trends analysis output plots.
Notably, the trends of one economic indicator did not mirror the parallelity of the other eight (Figure D). The trend analysis for the percentage of state residents living in poverty between the two states indicates that North Carolina had a spike in poverty in 2003 at a bit under 16% while Georgia’s rate was about 12%. From 2003 to 2005, the North Carolina poverty rate trended down while the Georgian rate trended up. The Georgian poverty rate was about one percentage point above the North Carolinian poverty rate in 2005. The next year, 2006, North Carolina’s poverty rate was higher than Georgia again, by about one percentage point. While the lack of parallelism in the trends for this variable during the pre period may give pause when evaluating the suitability of the two states for a DID analysis, the range of percentage point change between and among both states is only around 4%.
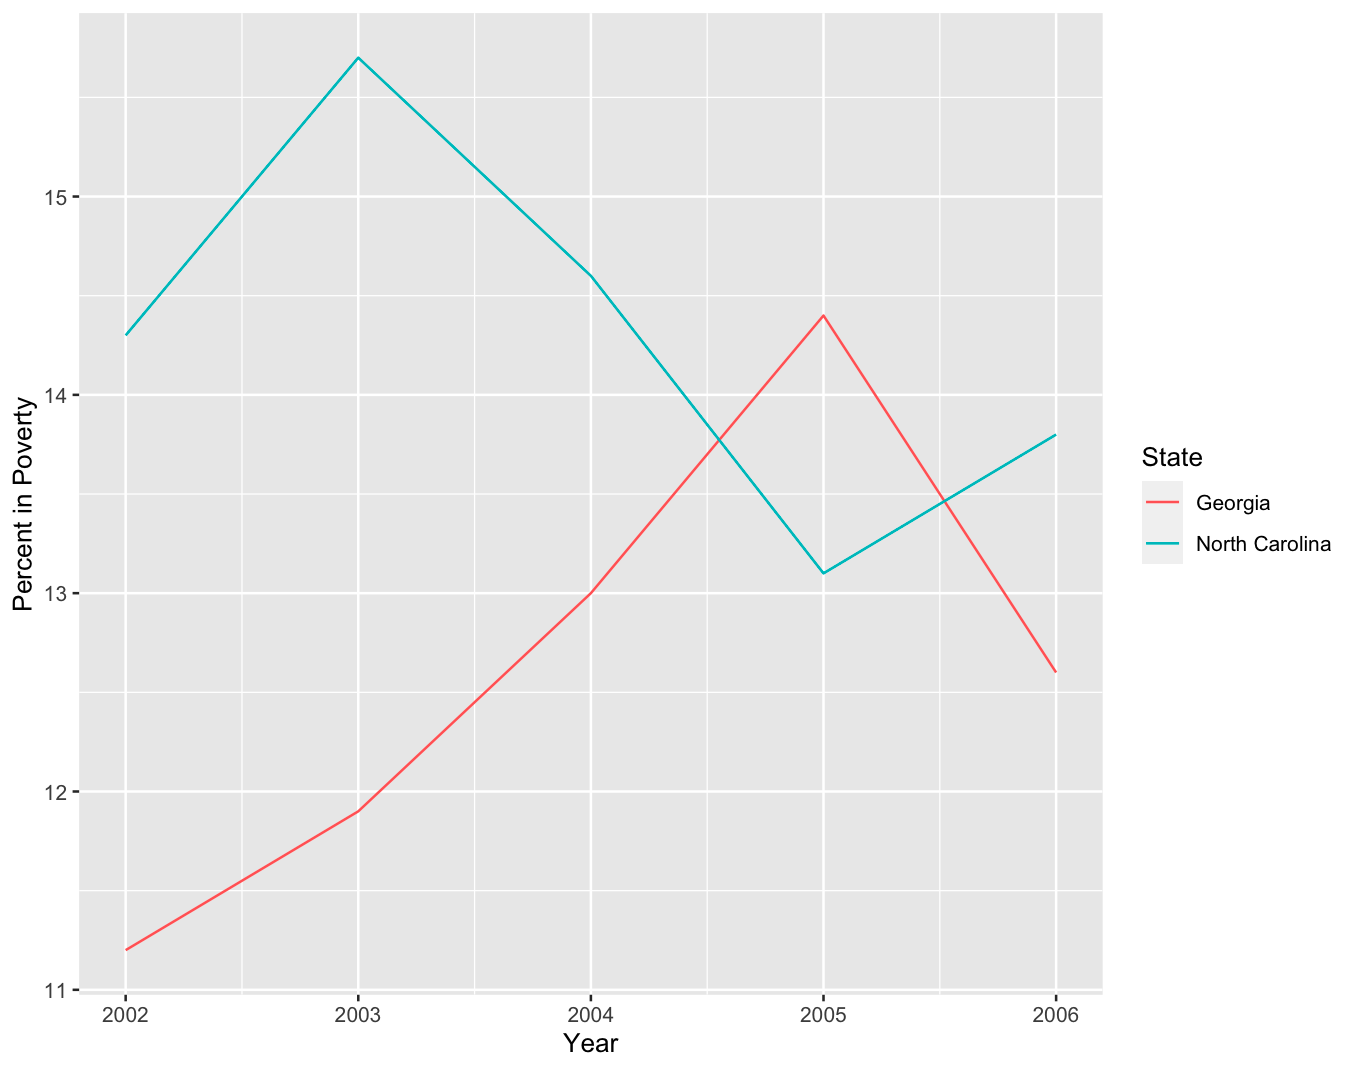
Figure D: Percent in Poverty variable trend by state in the pre period
This analysis has thus established, by merit of their parallel trends, close geographic location and shared State Minimum Wage period followed by North Carolina increasing their minimum wage while Georgia’s remained stagnant, that North Carolina and Georgia are sufficient treatment (NC) and control (GA) groups for a DID analysis investigating the impact of increasing the minimum wage on other state-level economic indicators.
Hypotheses
I use regression to test three hypotheses:
There is a statistically significant decrease in the percentage of people living in poverty following an increase in state minimum wage.
There is a statistically significant increase in per capita personal consumption expenditures following increase in state minimum wage.
There is a statistically significant increase in per capita personal income following increase in state minimum wage.
DID Estimations
For all three of our hypotheses, we fail to reject the null hypothesis that increasing the state minimum wage does not have a statistically significant effect on our economic indicator variables. In other words, our model outputs do not show that there was a statistically significant change in poverty rates (Figure E), per capita personal consumption (Figure F) or per capita personal income (Figure G) following an increase in state minimum wage. Given these failures to reject the null hypothesis, we cannot conclude that increasing the minimum wage improved economic conditions as measured by these specific variables across the whole state-wide population.
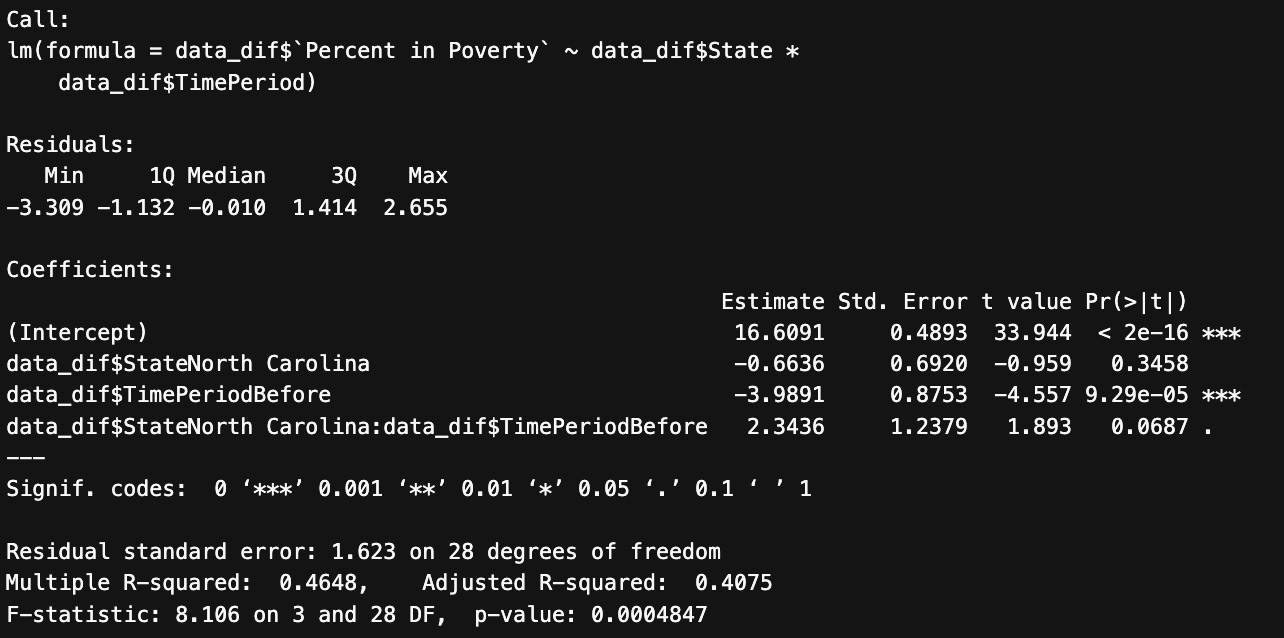
Figure E: Output of DID model to test hypothesis one
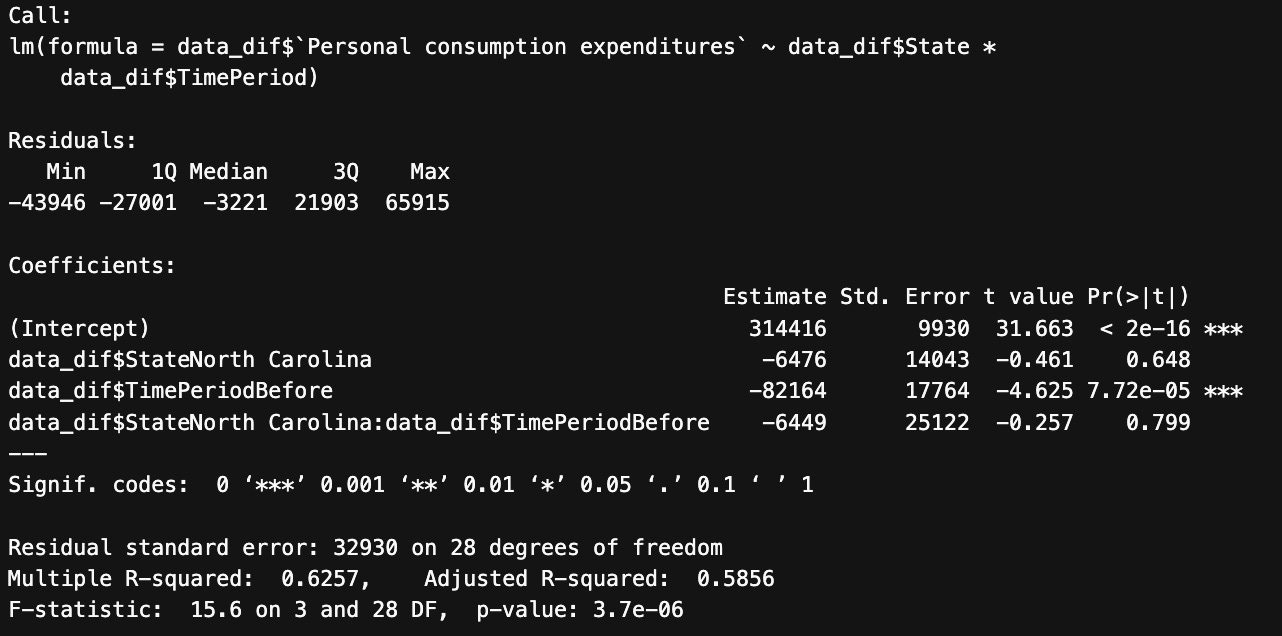
Figure F: Output of DID model to test hypothesis two
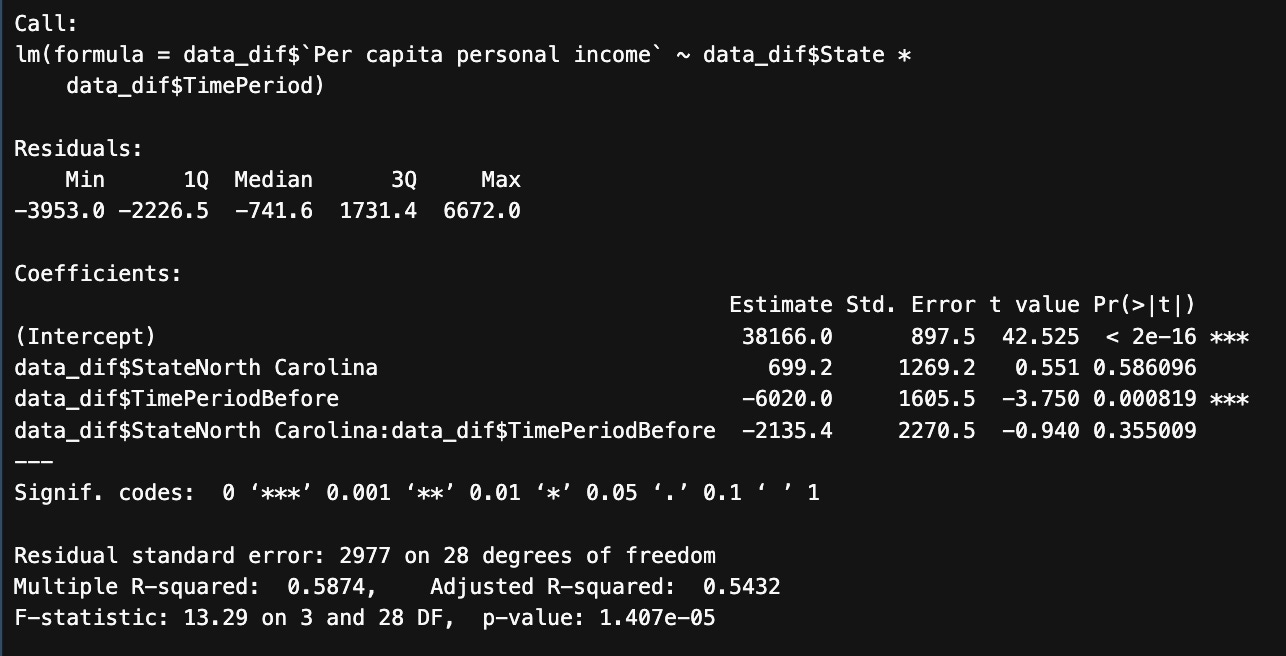
Figure G: Output of DID model to test hypothesis three
Robustness Check
I performed a robustness test by expanding the time range out to 2022 and ran another regression for the first hypothesis - that there is a statistically significant decrease in the percentage of people living in poverty following an increase in state minimum wage (Figure H). The time-expanded regression indicates a slight directionality shift. While the p-value for the coefficient remained insignificant, the coefficient for the time-expanded regression was slightly lower. The coefficient for the interaction term decreased from about 2.34 to 2.15 when I expanded the dataset to include data up to 2022. This directionality shift indicates that the positive association between increasing the minimum wage and poverty rates weakened over time. Another interpretation is that this shift in the coefficient is evidence that increasing the minimum wage has a positive effect on statewide poverty rates (increases them), but that this effect diminishes over time.
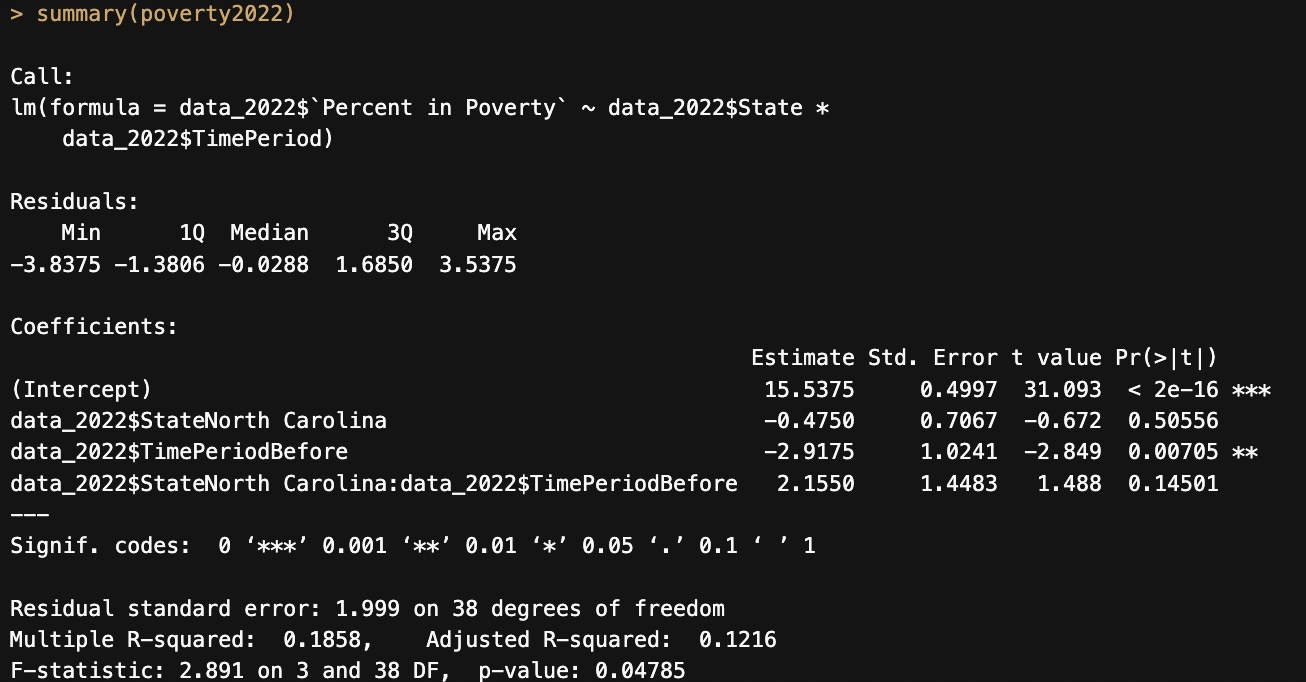
Figure H: Robustness check, time-expanded-data model
Policy Implications
Given various limitations of this research design, most significantly that we are using statewide economic metrics for an analysis of the impact of a policy that is likely to most readily impact a specific segment of society (the lowest wage workers), this analysis is inconclusive and policy implications should be derived from additional analytic investigations. The collection and analysis of economic data for the subset of the population that actually works in minimum wage jobs would likely be a more suitable parameter. Arguably, one key takeaway from the analysis is that the minimum wage increases in North Carolina did not significantly impact our statewide economic indicators of interest. If specifically moving the needle on those indicators is the goal, perhaps another policy is more suitable than a minimum wage increase. I would also propose, in closing, that the minimum wage increase in our treatment group was ultimately quite small; the overall change of $2.10 has not increased since 2010.